
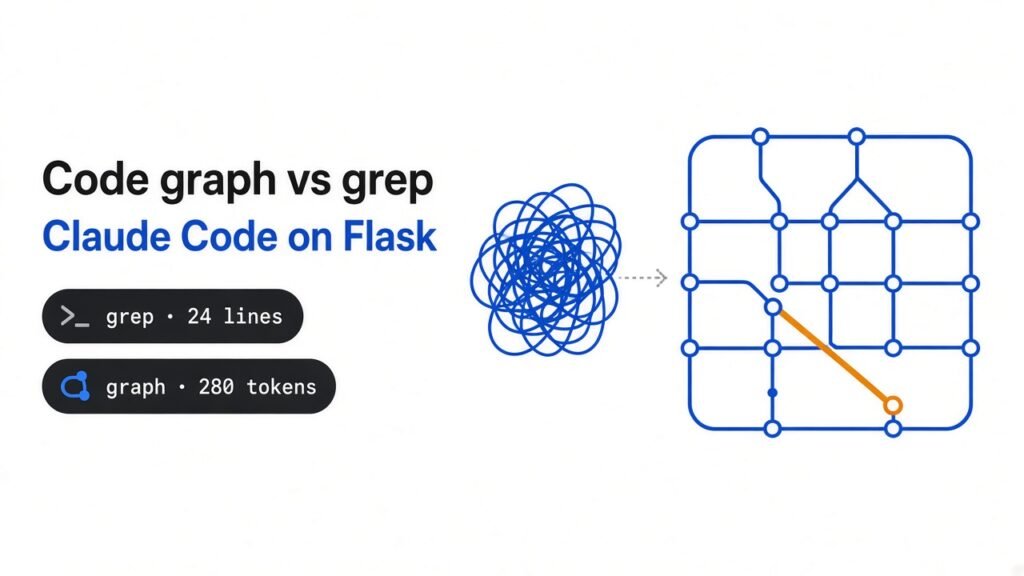
Twenty-four lines. That is what grep hands back when you ask where Flask’s dispatch_request lives and who calls it. Three of those hits are three different functions that happen to share one name. Grep does not tell you which is which. Neither does your agent, until it opens the files and reads them.
Short answer, before the story: Claude Code does not index your codebase. It searches with grep and reads files on demand. A code graph MCP server adds a prebuilt map of who calls what. On Flask, the one I tested answered a call-chain question in about 1,100 bytes and caught a name clash grep walked straight past. It also invented one call that does not exist. Use the graph as a map. Read the file before you edit.
That pitch showed up this week on Trendshift’s live-mentions board, attached to a small repo called code-graph-mcp: “Tired of coding agents grepping blindly and still missing the call chain.” It had about 75 stars when I looked. I wanted to know if the claim holds, so I ran both tools on the same question, on the same commit, and measured what came out.
Does Claude Code index your codebase?
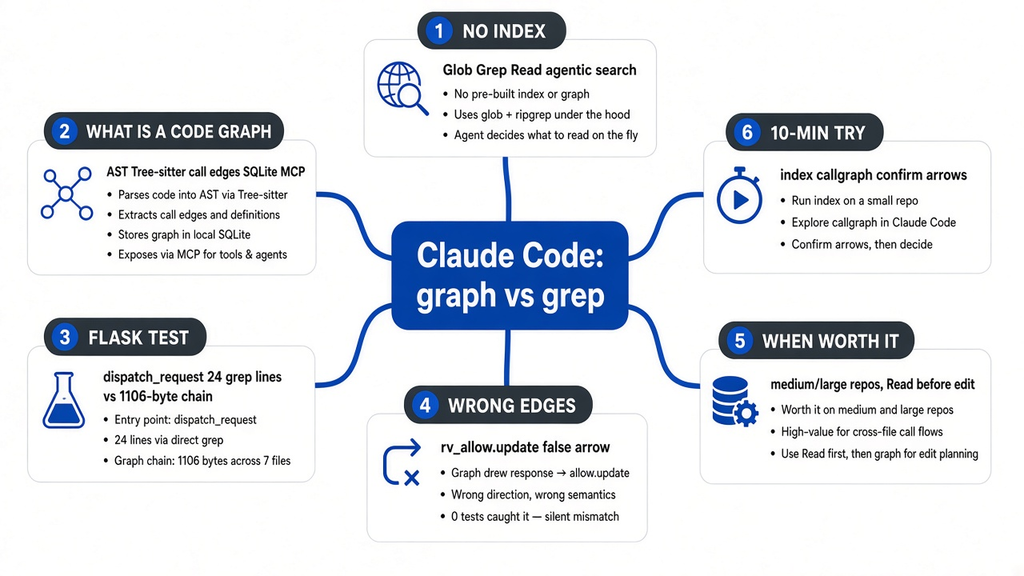
No. And that was a choice, not an oversight.
Start with what an agent can see. A model reads text through a context window (the fixed amount of text it can hold in one request). Everything it knows about your repo has to fit in there, measured in tokens (small chunks of text, roughly four characters each in English and code). So the agent needs a way to find the right few files without pouring the whole repo in.
Claude Code does that with three plain tools. Glob finds files by name pattern. Grep finds lines that contain a string. Read opens a file, or part of one, and puts it in the window. People call this loop agentic search (the model decides what to look up next, one step at a time, instead of querying a prebuilt index).
Boris Cherny, who created Claude Code, has said early versions used RAG (retrieval augmented generation, fetching chunks from a search index and pasting them into the prompt) with a local vector database, and that “agentic search generally works better.” This write-up collects his reasons: nothing stale, nothing extra stored, fewer moving parts. Those reasons are good. Grep is always looking at the code as it is right now.
Where grep hurts is the question that has two parts. “Who calls this function?” is easy when the name is unique. It gets expensive when three classes each define a method with that name, or when the answer is three hops away. Grep matches text. It has no idea what a caller is.
What is a code graph, in plain words?
Think of grep as Ctrl+F on a phone book. It finds every page where a name is printed. A code graph is the metro map. It shows which stations connect, and in what direction.
To build that map, a tool first parses your code (reads it the way a compiler does, as structure instead of loose text). The result is an AST (abstract syntax tree, your program broken into a tree of parts: this file has this class, which has this method, which calls that function). code-graph-mcp uses Tree-sitter (a fast, widely used parser that understands many languages) to do this for 19 languages, with full call tracking for TypeScript, JavaScript, Go, Python, Rust and Java.
From the tree, it pulls out nodes (functions, classes, methods) and edges (arrows between them: calls, imports, inherits). A call graph is just the subset of arrows that mean “this function calls that one.” Walk the arrows backwards and you get every caller. Walk them forwards and you get everything a change might touch.
It saves all of this in a SQLite file at .code-graph/index.db inside your project and refreshes only the files that changed. Then it exposes the map through MCP (Model Context Protocol, the standard plug that lets Claude Code call an outside tool). Seven tools show up in the session, including get_call_graph, find_references and semantic_code_search.
One more thing you need before the test makes sense. Python does not declare types on most variables. When the code says rv.allow.update(methods), a parser cannot always know what rv.allow is. So it guesses the target by name. Hold on to that. It matters in a minute.
The test: one question, two tools
Setup, so you can check me. Flask at commit d73fa1c (Sept 8, 2026), 83 Python files and 18,345 lines of Python. code-graph-mcp 0.157.0 through npx, run on Sept 25, 2026, on a Linux box. I used the CLI (command line) that ships in the same package, because it calls the same index the MCP tools read.
Indexing took 1.7 seconds on the first run, including the npx startup. The built-in benchmark put the index itself at 641 ms for 109 files, 1,867 nodes and 12,529 edges. A no-change refresh took 5 ms. The database came to 6.8 MB. None of that is a reason to hesitate.
The question: “If I change dispatch_request on the Flask app class, what calls it?”
Grep first. grep -rn "dispatch_request" --include=*.py . returned 24 lines across 5 files, 1,933 bytes of output. The real definitions sit at src/flask/app.py:969, src/flask/views.py:78 and src/flask/views.py:182, plus a fourth def inside a docstring example at views.py:30. Every call site looks the same: self.dispatch_request. To learn which method a given line reaches, you read the class around it. app.py alone is 65,472 bytes, about 16,000 tokens by the four-character rule. To be fair to Claude Code, it usually reads slices, not whole files. It still has to read something.
Then the graph. npx -y @sdsrs/code-graph callgraph dispatch_request refused to answer. It said the name was ambiguous, listed the three real methods with their files, and asked me to pick. It skipped the docstring one, because that is a string, not code. That refusal is the best thing it did all day. Grep never tells you it is confused.
With --file src/flask/app.py added, it printed the chain: dispatch_request is called by full_dispatch_request, which is called by wsgi_app, which is called by __call__. That output was 1,106 bytes, roughly 280 tokens. I checked it by hand. Line 1019 of app.py is rv = self.dispatch_request(ctx), inside full_dispatch_request. Correct.
| Same question | grep | code graph |
|---|---|---|
| Output size | 24 lines, 1,933 bytes | 1,106 bytes, about 280 tokens |
| Same-name clash | Mixed together, silent | Refused and listed all 3 |
| Multi-hop callers | One hop, then read and grep again | 3 hops in one call |
| Freshness | Always current | 5 ms refresh, but needs the refresh |
| Wrong answers seen | None, it only matches text | 1 invented call, 1 missed test path |
Where the code graph got it wrong
The same call-graph printout also listed what dispatch_request calls. One branch went: make_default_options_response calls update, in examples/tutorial/flaskr/blog.py. Then it kept going from there into url_for, render_template, flash and get_db.
That is false. Here is the real line inside make_default_options_response:
rv.allow.update(methods)That update adds HTTP methods to the Allow header of a response. It is a set-style update on a header object. The graph saw the word update, found a function named update in Flask’s tutorial blog app, and drew an arrow. Remember the typing problem from earlier. This is it, in the wild.
Picture an agent that trusts that output. You ask it to tweak how Flask answers OPTIONS requests. It reports that the change reaches the tutorial’s database code and offers to “check get_db for side effects.” Now you are reviewing a detour the code never takes.
The find_references view is more careful. When I ran refs url_for, every hit came tagged ~inferred or ~ambiguous, which is the tool admitting it guessed. The call-graph printout I got did not show a tag on the bad update edge. So the caution exists in the tool. It just does not follow you into every view.
Second miss, quieter. I ran impact make_default_options_response. It said “Risk: LOW” and “0 tests affected.” Flask’s own tests/test_basic.py sends OPTIONS requests at lines 38, 52, 85, 102 and 115, through the test client (a fake browser that calls the app over HTTP inside the test). Those tests reach this method, just not by a direct Python call. The graph only follows direct calls, so it cannot see them. “0 tests affected” is a fact about the graph, not about your test suite.
Is a code graph MCP worth it for Claude Code?
Yes, on the right repo, with one rule attached.
It earns its place on a medium or large codebase where names repeat and call chains run deep. The ambiguity warning alone would have saved a wrong read on Flask. Three hops in one call, at a few hundred tokens, is a better deal than grep, read, grep, read. And indexing is cheap enough that nobody should skip it on speed grounds.
It is not worth it on a small repo where grep gives you five hits and one file to read. It is also weaker in Python and plain JavaScript than in Go, Rust, Java or TypeScript, because types are what let a parser know which update you meant.
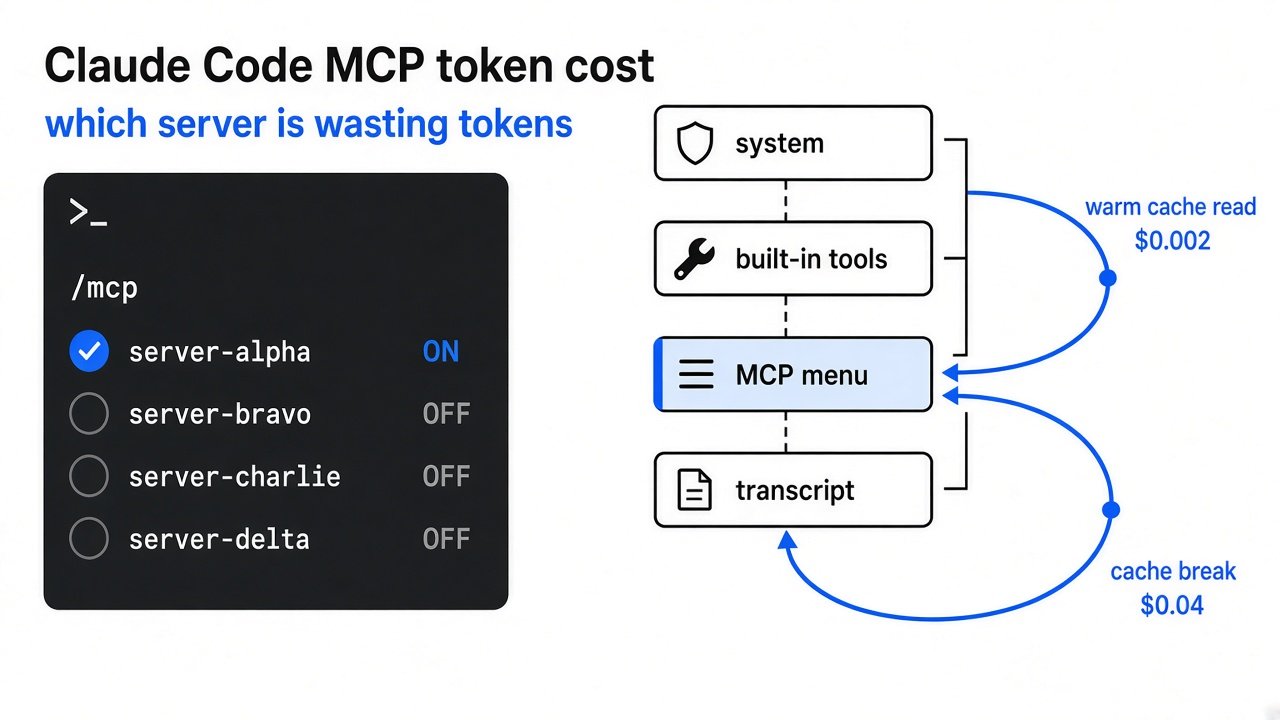
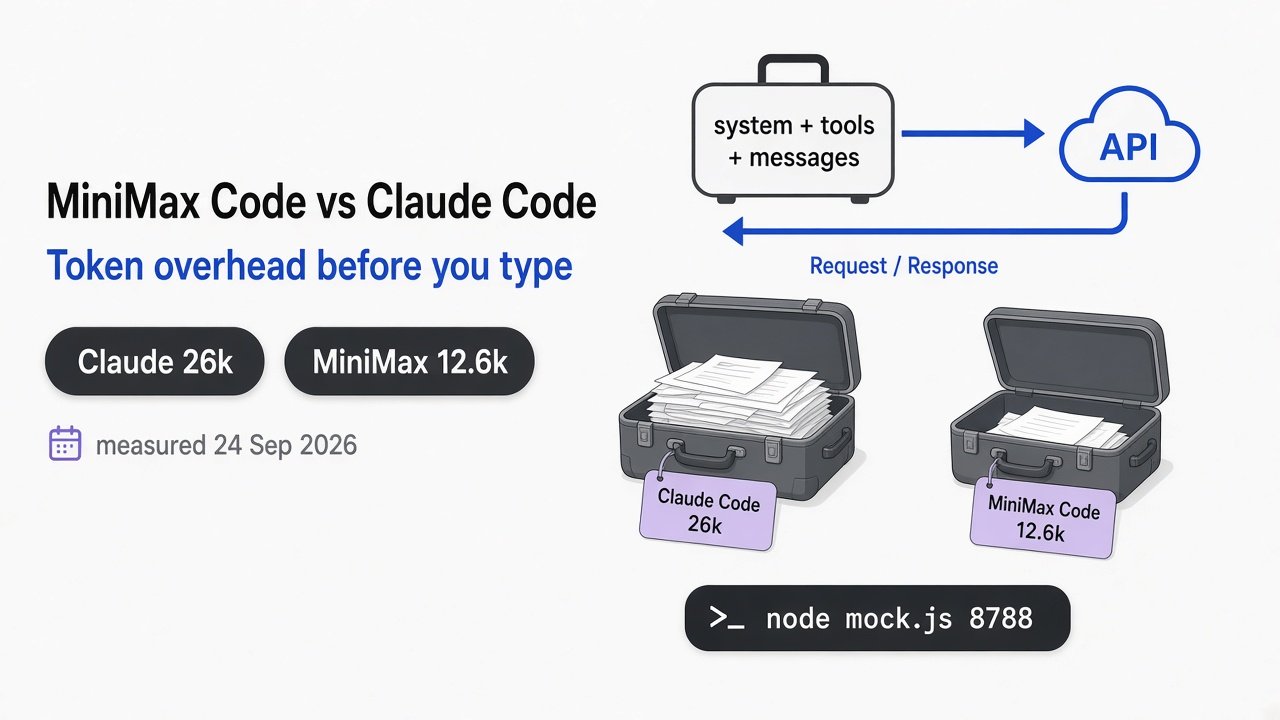
There is a fixed cost too. I asked the MCP server for its tool list. Seven tools came back as 9,497 bytes of definitions, plus 1,067 bytes of instructions, about 2,600 tokens. If your setup loads MCP tools into every session, that rides along before you type. The token overhead test showed a bare Claude Code session already spends on the order of 26,000 tokens up front. Another 10% is fine if the graph gets used. It is waste if it sits idle on a toy project.
Here is the rule. The graph draws the map. A Read confirms the road before any edit. If the graph says function A calls function B, have the agent open A and find the line. That costs one small read and would have caught the fake update arrow in five seconds.
The CLI also has an adopt command that installs a steering block into your project’s CLAUDE.md (the instructions file Claude Code reads at the start of every session). I did not run it. If you do, read the diff it leaves. The systemd canary piece is a reminder that what lives in that file shapes everything after, and that an agent may still skip it.
Try it on your own repo in 10 minutes
Use a repo you know well, so you can tell when the map is wrong.
1. Build the index from the repo root:
npx -y @sdsrs/code-graph incremental-index2. Pick a function name you know is reused. Run grep and count the lines:
grep -rn "your_name" .3. Run the call graph. If it says ambiguous, add --file path/to/the/one/you/mean.py.
npx -y @sdsrs/code-graph callgraph your_namenpx -y @sdsrs/code-graph callgraph your_name --file path/to/the/one/you/mean.py4. For every caller and callee it prints, open the file and find the line. Mark each arrow right or wrong.
5. Run impact and compare its test count with the tests you know hit that code:
npx -y @sdsrs/code-graph impact your_name6. Only if most arrows held up, add it to Claude Code:
claude mcp add code-graph-mcp -- npx -y @sdsrs/code-graph7. Add one line to CLAUDE.md:
Before editing, confirm any call-graph edge by reading the calling line.If step 4 turns up more than one wrong arrow in ten, keep grep. It is slower, but it never lies about what the text says.
Common questions about Claude Code and code graphs
Does Claude Code index your codebase?
No. Claude Code searches with Glob, Grep and Read at the moment it needs something, and Anthropic chose that over a vector index because it stays current and stores nothing extra. You can add an index yourself through an MCP server.
What is a code graph MCP server?
It is a local program that parses your code into functions, classes and the calls between them, stores that map, and lets Claude Code query it through MCP. You ask “who calls X” and get a chain back, instead of a list of text matches.
Is a code graph more accurate than grep?
It is smarter about structure and less honest about text. On Flask it caught a three-way name clash grep ignored, and it also drew one call that does not exist, because Python’s missing types forced a guess. Grep never guesses. It also never understands.
How many tokens does code-graph-mcp add to Claude Code?
In my test, its seven tool definitions plus instructions came to about 10.5 KB, roughly 2,600 tokens, if they load into every session. A single call-chain answer was about 280 tokens.
If you try one thing from this page, make it step 4. Open the file behind every arrow on a repo you know. Ten minutes of that tells you whether your agent should get a map, or keep its flashlight.
2 comments